Distributed Tracing with Kafka Streams
Distributed tracing is a method used to profile and monitor applications, especially those built using a microservices architecture. Distributed tracing helps pinpoint where failures occur and what causes poor performance.[1] Applied to Kafka Streams it allows us to trace and visualize our messages by propagating diagnostic information within message headers.
Full-fledged support for appending diagnostic information to traces in Kafka Streams applications is fairly recent. It centers on the instrumentation in Brave, with Spring Boot AutoConfiguration available as of Spring Cloud Sleuth 2.2.0+.
Kafka Streams demo application
To demonstrate distributed tracing with Kafka Streams I’ve created a demo application. This rather minimal demo application takes an input stream of numbers, which it then splits out into two separate topics for odd and even numbers.
Without any tracing this application would look like this.
@Bean
public KStream<String, Integer> doStream(StreamsBuilder builder) throws Exception {
  return new KafkaStreamBrancher<String, Integer>()
      .branch((k, v) -> v % 2 == 0, evenStream -> evenStream.to(EVEN_NUMBERS_TOPIC))
      .defaultBranch(oddStream -> oddStream.to(ODD_NUMBERS_TOPIC))
      .onTopOf(builder.stream(NUMBERS_TOPIC));
}
Adding tracing
Merely adding Sleuth to a Kafka Streams application will already show you the topology edges, by adding a tracing client supplier to the StreamsBuilder.
At present, further tracing within Kafka Streams is fairly explicit, especially when compared to similar HTTP client instrumentation, or even @KafkaListener use.
Instead of tracing being added behind the scenes through framework hooks, here we have to explicitly instrument our operations through the use of Brave KafkaStreamsTracing and Tracer.
To add diagnostic information to the current span context, we first create an operation aware of the current trace.
We do this through invoking KafkaStreamsTracing#peek(String, ForeachAction<K, V>).
The first argument is the name of the span to create.
The second argument is an action to apply to each element of the Stream.
peek returns a TracingValueTransformerWithKeySupplier, which we can pass into KStream#transformValues.
| For details on how to instrument other operations, have a look at the Brave Kafka Streams instrumentation documentation. |
Now secondly we’ll want to log a message, and have that message automatically contain the trace related MDC variables.
We achieve that through the same peek operation as before, which now contains two log statements.
The first log statement will automatically add the Sleuth trace identifiers in the default log format.
The second log statement explicitly logs all Mapped Diagnostic Context variables, just to show they’re available.
Finally, we want to demonstrate that the trace context information is only available when using the explicit instrumentation.
For that, we add a third log statement to the odd numbers stream that uses a regular old KStream#peek.
With the above changes, we end up at the following code.
private final KafkaStreamsTracing kafkaStreamsTracing;
private final Tracer tracer;

@Bean
public KStream<String, Integer> doStream(StreamsBuilder builder) throws Exception {
  KStream<String, Integer> numbersStream = builder.stream(NUMBERS_TOPIC);
  numbersStream
      // Append diagnostic information
      .transformValues(kafkaStreamsTracing.peek("set", (k, v) -> {
        ExtraFieldPropagation.set(tracer.currentSpan().context(), "messageid", "messageid_" + v);
        log.info("set messageid for {} -> {}", k, v);
      }));

  return new KafkaStreamBrancher<String, Integer>()
      .branch((k, v) -> v % 2 == 0, evenStream -> evenStream
            // Log with trace context
            .transformValues(kafkaStreamsTracing.peek("even", (k, v) -> {
              log.info("Even: {} -> {}", k, v);
              log.info("MDC: {}", MDC.getCopyOfContextMap());
            }))
            .to(EVEN_NUMBERS_TOPIC))
      .defaultBranch(oddStream -> oddStream
            // Log without trace context
            .peek((k, v) -> log.info("Odd: {} -> {}", k, v))
            .to(ODD_NUMBERS_TOPIC))
      .onTopOf(numbersStream);
}
Running the demo application
The demo application contains a docker-compose.yml file to easily start Kafka and Zipkin together, along with the necessary topics.
When both are available, the application can be started like any regular Spring Boot application.
I’ve added a small StreamsConfigTest class, which creates its own producers and consumers to write numbers to the input topic, and listen to numbers from the odd and even output topics.
When the tests are run, numbers 1, 2 and 3 are put on the numbers topic, which produces the following log output.
INFO [app,53459172072115497126152695641873,ae4f86e501f98b07,true]
  --- [-StreamThread-1] StreamsConfig: set messageid for trace-propagation -> 1
INFO [app,,,]
  --- [-StreamThread-1] StreamsConfig: Odd: trace-propagation -> 1

INFO [app,53459172072115497126152695641873,9bb751c7396dfde2,true]
  --- [-StreamThread-1] StreamsConfig: set messageid for trace-propagation -> 2
INFO [app,53459172072115497126152695641873,088bcff034578c1a,true]
  --- [-StreamThread-1] StreamsConfig: Even: trace-propagation -> 2
INFO [app,53459172072115497126152695641873,088bcff034578c1a,true]
  --- [-StreamThread-1] StreamsConfig: MDC: {
  traceId=53459172072115497126152695641873, spanId=088bcff034578c1a,
  parentId=9bb751c7396dfde2, spanExportable=true,
  X-B3-TraceId=53459172072115497126152695641873, X-B3-SpanId=088bcff034578c1a,
  X-B3-ParentSpanId=9bb751c7396dfde2, X-Span-Export=true,
  messageid=messageid_2 }

INFO [app,53459172072115497126152695641873,830d23faf8f53cfc,true]
  --- [-StreamThread-1] StreamsConfig: set messageid for trace-propagation -> 3
INFO [app,,,]
  --- [-StreamThread-1] StreamsConfig: Odd: trace-propagation -> 3
You’ll see each input message resulted in two log messages for odd numbers, and three logged messages for even numbers.
As indicated in the source comments, for odd numbers, the second log line does not contain the trace context information.
This is because explicit instrumentation through KafkaStreamsTracing is a hard requirement for log correlation, for now. However, trace headers are forwarded nonetheless, and a new span is still created when sending a message to the odd-numbers topic.
For even numbers we do see trace and span identifiers logged with our messages.
And when we explicitly log all MDC variables we even see the messageid set before through ExtraFieldPropagation.
This means that when using for instance Logstash Logback Encoder, all MDC variables will be available in the log output.
Notable too, is the fact that we see the same traceId, but a different spanId logged; indicating separate spans are created here as well.
You’ll see these details first hand when opening up Zipkin through http://localhost:9411/zipkin/.
Visualization in Zipkin
Now log correlation by itself, especially with business oriented additional diagnostic information is useful enough when debugging. But as I’ve found time and again, there’s valuable insights to be gained from visualizing sampled trace data, both for individual slow traces, as well to explore the network of interactions. For this, Sleuth can send a sampling of traces to Zipkin for visualization.
To explore the traces stored in zipkin, you can search for and filter on serviceName, spanName, min/max duration and remoteServiceName, as well as particular tags, all within a certain time frame.
When selecting a particular trace, you might see a visualization such as the following.
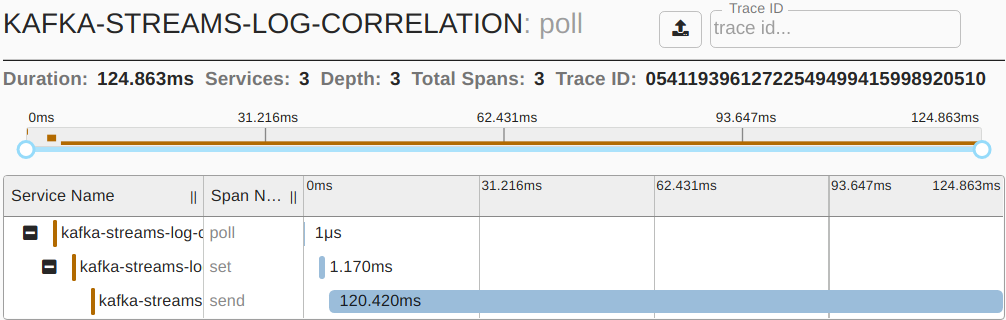 Here you can clearly see how much time was spent on each of the processing steps.
You’ll notice the named span
Here you can clearly see how much time was spent on each of the processing steps.
You’ll notice the named span set corresponds to our instrumentation in the code above.
For larger traces spanning multiple services, this is a perfect starting point to identify performance bottlenecks.
Dependency graph and customization
Zipkin also has the option to convert a collection of traces into a network of nodes and edges, allowing you to explore the topology.
However, by default the network generated for Kafka Streams applications will be rather dull.
 You’ll notice that even though our application consumes from one topic, and writes to two topics, all three are visualized as a single "kafka" node.
This is far from ideal, as even a large network of applications using a diverse set of topics, will all just point to a single "kafka" node.
Now luckily, we can change this by adding a
You’ll notice that even though our application consumes from one topic, and writes to two topics, all three are visualized as a single "kafka" node.
This is far from ideal, as even a large network of applications using a diverse set of topics, will all just point to a single "kafka" node.
Now luckily, we can change this by adding a FinishedSpanHandler to our application.
@Bean
public FinishedSpanHandler finishedSpanHandler() {
  // Suffix remote service name "kafka" with topic name for clearer dependency graph
  return new FinishedSpanHandler() {
      @Override
      public boolean handle(TraceContext context, MutableSpan span) {
        String topic = span.tag("kafka.topic");
        if (topic != null) {
          span.remoteServiceName(span.remoteServiceName() + '/' + topic);
        }
        return true;
      }
  };
}
As the topic name is available as a tag within our span context, we can append this to the remoteServiceName before the span is sent to Zipkin.
Our improved network graph will then create an individual node for each topic, rather than for kafka as a whole.
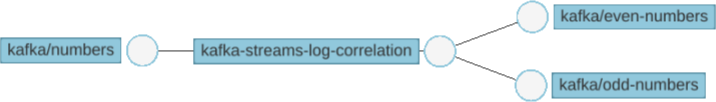
Now with all this in place we’re perfectly set to better comprehend and optimize our Kafka Streams applications!
