HotSpot JVM optimizations
This is an overview of some optimization techniques used by Hotspot JVM to increase performance. I will start by giving a small example of how I ran into these optimizations while writing a naive benchmark. Each optimization is then explained with a short example and ends with some pointers on how to analyze your own code.
Background
A long time ago I wrote a simple metrics library in Java and Go with similar implementations. I expected their performance to be comparable, albeit, with a slight edge for Go. After benchmarking both libraries I found that Java was much faster. That didn’t make a lot of sense for such a simple thing so I investigated the runtime behavior of both libraries and noticed that most of the time the Go implementation was waiting to acquire and release the lock. I didn’t see that behavior in Java. The reason for this was that the Java JIT compiler optimized the code during runtime due to my test set-up. In this post I want to mention some of the optimizations that the Java runtime might do.
Simplified example
I will provide a simplified and contrived implementation of a metrics library to illustrate some of the optimization techniques of the JIT compiler. The metrics library keeps track of gauges. A gauge is single value that can go up or down, for example, active sessions. The library can be used as follows:
METRICS.gauge("sessions.active", Container.activeSessions());METRICS.gauge() can be implemented in a few ways, but for now let’s say that the gauge() method takes a lock, updates the internal state and then releases the lock:
public class Gauge {
    public long timesModified = 0;
    public long value = 0;
}

public class Metrics {
    public static final Metrics METRICS = new Metrics();

    private final Lock lock = new ReentrantLock();

    private final Map<String, Gauge> state = new HashMap<>();

    public void gauge(String name, long newValue) {
        try {
            lock.lock();
            Gauge gauge = state.computeIfAbsent(name, n -> new Gauge());
            gauge.timesModified++;
            gauge.value = newValue;
        } finally {
            lock.unlock();
        }
    }

    public Gauge getGauge(name) {
        try {
            lock.lock();
            return state.get(name);
        } finally {
            lock.unlock();
        }
    }
}
Now let’s add a performance test to measure the overhead of the metrics library. The test just calls the gauge() method a large number of times in a loop and prints the duration (again, this is a contrived example!):
@Before
public void warmUpJVM() {
  // For example see: https://www.baeldung.com/java-jvm-warmup
}

@Test
public void testPerformanceSingleThreaded() {
    int numIterations = 500000;
    long start = System.currentTimeMillis();

    for (int i = 0; i < numIterations; i++) {
        METRICS.gauge("test.metric", i);
    }

    Gauge gauge = METRICS.getGauge("test.metric")
    assertThat(gauge.getTimesCalled()).isEqualTo(numIterations);
    assertThat(gauge.getValue()).isEqualTo(499999);

    long duration = System.currentTimeMillis() - start;
    System.out.println(String.format("Java %d iterations took = %d ms", numIterations, duration));
}
The test runs very fast. Imagine you also have a Go implementation of this library. If you build this, the output is more likely to be as follows:
Java 500000 iterations took 30ms;
Golang 500000 iterations took 210ms;
Why would the difference be so big? After some investigation, it appeared that the JVM optimized the code during runtime, whereas the compiled Golang code does exactly what it’s told and takes the lock every iteration. Golang does this because it’s directly compiled to native machine code. The Java Virtual Machine, on the other hand, interprets bytecode which can be optimized further.
JIT optimizations
The following sections discuss some of the optimizations of the openjdk JVM. This is a quick overview of how the Java source code is compiled and executed:
Java source code is compiled to bytecode. Bytecode is an intermediate format that can be interpreted by a virtual machine.
When a JVM is started, it interprets the bytecode and executes it.
The JVM, or JIT Compiler, monitors which bytecode is being used a lot during runtime, the so called 'hot' code. Hot code can be further optimized and compiled into platform native machine code which is considerably faster than interpretation.
Inlining
Inlining is one of the simplest but most widely used techniques. It replaces a method invocation with the body of the method. This reduces the overhead of making a method call.
public long multiply(long x, long y) {
    return x * y;
}

public void calculator() {
    long result = multiply(10, 20);
}
Multiply would be a great candidate for inlining:
public void calculator() {
    long result = 10 * 20;
}
Lock coarsening
The JVM can detect that the lock is called within a loop at runtime. It can then decide to rewrite the code automatically to take the lock only once every n iterations, which reduces the overhead. This technique is called 'lock coarsening'. The following code gives a rough idea of how this could (NOTE, COULD!) look:
// Runtime version of the gauge() method after lock coarsening
public void gauge(String eventName, long newValue) {
    Gauge gauge = state.computeIfAbsent(name, n -> new Gauge());
    gauge.timesModified++;
    gauge.value = newValue;
}

// Possible runtime version of the loop inside the test
METRICS.lock.lock();
try {
    for (int i = 0; i < 20; i++) {
        METRICS.gauge("test.metric", i);
    }
} finally {
    METRICS.lock.unlock();
}

METRICS.lock.lock();
try {
    for (int i = 20; i < 40; i++) {
        METRICS.gauge("test.metric", i);
    }
} finally {
    METRICS.lock.unlock();
}
...
METRICS.lock.lock();
try {
    for (int i = 499960; i < numIterations; i++) {
        METRICS.gauge("test.metric", i);
    }
} finally {
    METRICS.lock.unlock();
}
Lock coarsening can also work for code that takes a lock multiple times in a row. For example, when you call multiple synchronized methods on the same object. Instead of releasing and re-taking the lock, the compiler can choose to do that only once.
The code below gives you an idea of how this might look:
lock.lock();
//do something
lock.unlock();

lock.lock();
//do another thing
lock.unlock();
This can sometimes be converted into:
lock.lock();
//do something
//do another thing
lock.unlock();
Loop unrolling
If you have to perform the same action multiple times within your code, you use a loop. At the end of each iteration, the CPU needs to jump back to the beginning of the loop. A jump can be a costly operation for a CPU, similar to a cache miss, which would mean having to go to main memory.
Loops that are part of 'hot code' can be optimized by the JIT compiler by unrolling them. A simple loop:
for(int i = 0; i < numIterations; i++) {
    METRICS.gauge("test.metric", i);
}
can be unrolled as follows:
for(int i = 0; i < numIterations; i += 5) {
    METRICS.gauge("test.metric", i);
    METRICS.gauge("test.metric", i+1);
    METRICS.gauge("test.metric", i+2);
    METRICS.gauge("test.metric", i+3);
    METRICS.gauge("test.metric", i+4);
}
The main benefit of unrolling loops is fewer jumps, thus allowing more efficient execution. Please refer to blogs.oracle.com/javamagazine/loop-unrolling for more information.
Escape analysis
Another technique employed by the JVM is escape analysis. It is not an optimization itself but it makes other optimizations like lock-elision and scalar replacement possible.
During escape analysis the JVM checks where objects are actually used. The result of the analysis for an object can be:
-
GlobalEscape - The object leaves the current method and possibly thread. (For example: the object is returned from the method, stored in a field)
-
ArgEscape - The object is passed on to other methods being called, but it does not escape any further like objects that have the state GlobalEscape.
-
NoEscape - The object is local and does not 'escape' the method.
Scalar replacement
When the object has the state NoEscape, the JIT compiler can sometimes choose not to allocate the object but treat the fields of the object as local variables. The fields of the object can often be stored in CPU registers as well, making it a lot faster.
The code below contains a very simple and contrived example where a method newId() creates an object that never leaves the scope of newId(). This will be classified as NoEscape.
public class IdGenerator {
    private long seed = System.nanoTime();

    public long getId() {
        return seed;
    }
}

public class IdUtil {
    public static long newId() {
        IdGenerator generator = new IdGenerator();
        return generator.getId();
    }
}
In this case the compiler can choose to not allocate the IdGenerator object, but just put the value of seed in a register and perform the getId() method using that value. This is a lot faster than memory access. The rewritten code without allocation could look as follows:
public class IdUtil {
    public static long newId() {
        return System.nanoTime();
    }
}
Lock elision
Escape analysis also enables lock elision. When the JVM sees that a lock is only accessible from 1 thread, it can completely remove the lock!
Our test calls the metrics library many times in loop. This means that in our single threaded performance test the lock might be optimized away! This is obviously good for performance, but it also means our test is worthless because in a production environment the metrics library is likely called from different threads and not in a loop.
In the earlier days of Java StringBuilder had better performance than StringBuffer because StringBuffer is synchronized. The difference in performance today is substantially lower because of techniques like escape analysis and lock elision. The StringBuffer objects usually do not escape to other threads and the synchronization can be omitted. The same holds true for Vector and ArrayList.
Inspecting JIT behaviour
If you want to take a deeper look into what the JVM does, you can do so by analyzing the HotSpot JVM’s runtime behavior.
The arguments -XX:+UnlockDiagnosticVMOptions -XX:+TraceClassLoading -XX:+LogCompilation instruct the JVM to write JIT actions to a logfile. That logfile is named hotspot_pid20172.log where the number after pid is the process identifier. This file contains a lot of XML explaining what the JVM is doing.
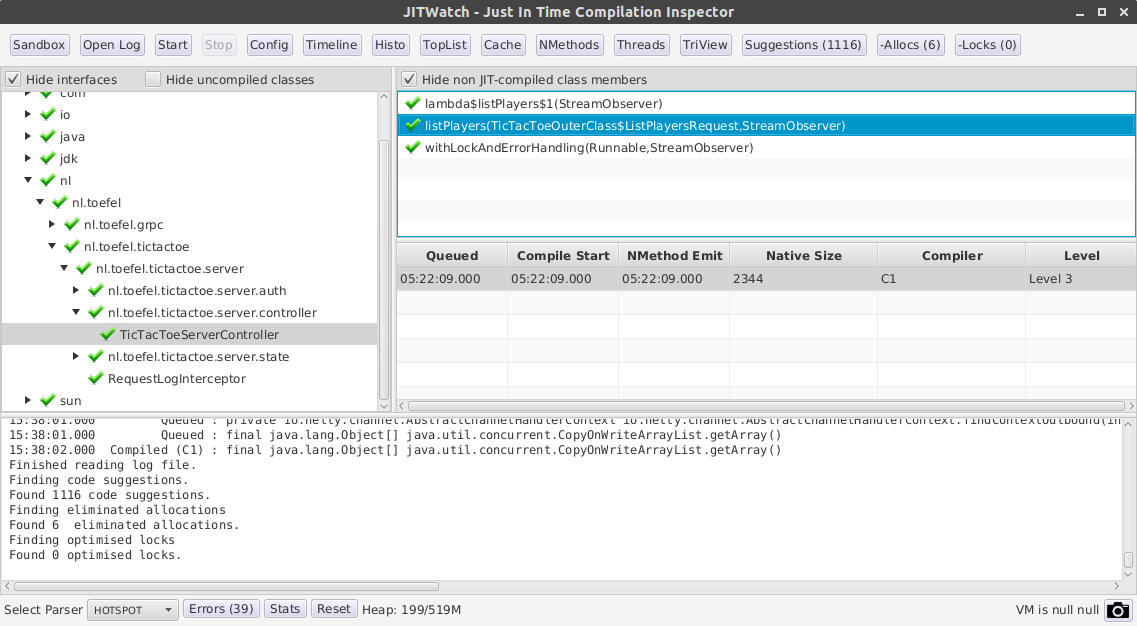
This file can be opened with JITWatch. JITWatch has a user interface that can show you:
-
inlining decisions
-
JIT compilation timeline
-
bytecode size and native code size
-
toplists of, for example, 'Inline failure reasons'
-
histograms of inlined method sizes, compilation times, etc.
-
eliminated allocation report (Scalar replacement)
-
optimized locks report
-
source code → bytecode → assembly
The image below shows you the user interface:
For an introductory video please view: HotSpot profiling with JITWatch
Writing benchmarks
If you decide to write a benchmark, I highly recommend using JMH (Java Microbenchmark Harness). JMH was built by the same developers as the JVM itself. It takes care of warming up your JVM and it helps to mitigate some of the pitfalls of writing good benchmarks.
Let’s try see if we can verify the JIT compiler scalar optimization using JMH.
@Warmup(iterations = 3, time = 1, timeUnit = TimeUnit.SECONDS)
@Measurement(iterations = 3, time = 1, timeUnit = TimeUnit.SECONDS)
@Fork(3)
@BenchmarkMode(Mode.AverageTime)
@OutputTimeUnit(TimeUnit.NANOSECONDS)
@State(Scope.Benchmark)
public class JITBenchmark {

    public class IdGenerator {
        private long seed = System.nanoTime();

        public long getId() {
            return seed;
        }
    }

    @Benchmark
    public long scalarReplacement() {
        IdGenerator idGenerator = new IdGenerator();
        return idGenerator.getId();
    }

}
When running this test with -prof gc, the benchmark prints the allocation rate and gc count:
Benchmark                                           Mode  Cnt   Score    Error   Units
JITBenchmark.scalarReplacement                      avgt    9  19.110 ±  1.007   ns/op
JITBenchmark.scalarReplacement:·gc.alloc.rate       avgt    9  ≈ 10⁻⁴           MB/sec
JITBenchmark.scalarReplacement:·gc.alloc.rate.norm  avgt    9  ≈ 10⁻⁵             B/op
JITBenchmark.scalarReplacement:·gc.count            avgt    9     ≈ 0           counts
As you can see, there are no objects allocated.
You can check out this repository to test it for yourself:
git clone https://github.com/toefel18/jmh-jit.git
cd jmh-jit
mvn clean install
java -jar target/benchmarks.jar -prof gc
If you want to know more about JMH, A good starting point is: oracle.com/technical-resources/articles/java/architect-benchmarking.html and shipilev.net/jvm/anatomy-quarks/18-scalar-replacement.
Conclusion
The JIT compiler has many cool techniques to optimize Java code during runtime. This is an advantage of having a virtual machine with bytecode over machine code. Usually you don’t have to worry about the optimizations being used, you can just enjoy faster execution. However, if you ever write a naive benchmark as I once did, you might run into them. This can trick you into thinking the performance is much higher than it would be in production.
Another takeaway from this article is that optimizing your code prematurely is less likely to be as effective as the optimizations applied by JIT compiler; write clean code first.
Sources:
-
https://wiki.openjdk.java.net/display/HotSpot/EscapeAnalysis
-
https://en.wikipedia.org/wiki/Escape_analysis#cite_note-:0-1
-
https://docs.oracle.com/javase/7/docs/technotes/guides/vm/performance-enhancements-7.html
-
https://shipilev.net/jvm/anatomy-quarks/18-scalar-replacement/
-
https://advancedweb.hu/2017/03/01/jvm_optimistic_optimizations/
-
https://www.oracle.com/technical-resources/articles/java/architect-benchmarking.html
-
https://www.ibm.com/developerworks/java/library/j-jtp09275/index.html
-
https://skillsmatter.com/skillscasts/5243-chris-newland-hotspot-profiling-with-jit-watch
