Easily build your own tech radar
The Thoughtworks Technology Radar is well known for showing technology trends and choices. For my project I wanted to have the same thing, not use the hosted public version from Thoughtworks, but a selfhosted option. Therefore I choose to base it on the Zalando opensource tech radar, and create a way to use a CSV file as input so updating would be an easy thing to do. To accomplish that I took the following steps:
-
Create a folder to put the tech radar into:
${project-folder}. -
Start with the HTML5 Boilerplate index.html file and put it into the
${project-folder}file. -
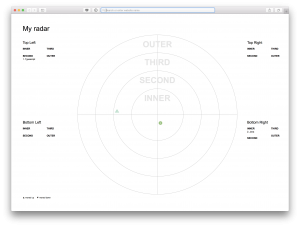
Insert the snippets as documented at Zalando Tech Radar, with one adjustment. I don’t fill the
entriesarray with entries, but will do that later on, from the input in the CSV file. Note the names of the rings and quadrants, as they will be used in the next step, the CSV. -
Create a CSV file (
${project-folder}/data.csv) as input for the tech radar. It has columns for the ring and quadrant where a technology should be put, and an indicator for movement. The names of the rings and quadrant should equal those in the configuration copied from the Zalando example. If you changed them, use those names instead. The movement indicator is (up, none, down) and in the next step translated in to value understood by the radar. The CSV will be translated into entries for the radar.name,ring,quadrant,moved,link Java,INNER,Bottom Right,none,../docs/java.html Typescript,SECOND,Top Left,up,../docs/typescript.html -
Add the following D3.js library to parse CSV:
<script src="https://d3js.org/d3-dsv.v1.min.js"></script>This library provides functions to parse CSV file(s) into a map structure per row in the file.
-
Create a function to transform a row in the CSV into an entry for the tech radar:
function toEntry(row) { return { label: row.name, quadrant: ['Bottom Right','Bottom Left','Top Left','Top Right'].indexOf(row.quadrant), ring: ['INNER','SECOND','THIRD','OUTER'].indexOf(row.ring), link: row.link, moved: ['down','none','up'].indexOf(row.moved) -1, active:true } } -
This is the diversion from the steps in the Zalando tech radar description. Wrap the
radar_visualization()function a custom one, that takes an array of entry, to render the transformed rows, e.g.draw_radar(entries).function draw_radar(my_entries) { radar_visualization({ ... entries: my_entries }); } -
Finally glue everything together to fetch the CSV, parse and transform it, and draw the entries. The code below uses the functions I defined in the previous steps
fetch('./data.csv')
  .then(function (resp) {
    return resp.text();
  })
  .then(function (csv) {
    var entries = d3.csvParse(csv,function (row) {
      return toEntry(row);
    });
    draw\_radar(entries);
  });
When you have followed the above steps, the result should look like this: